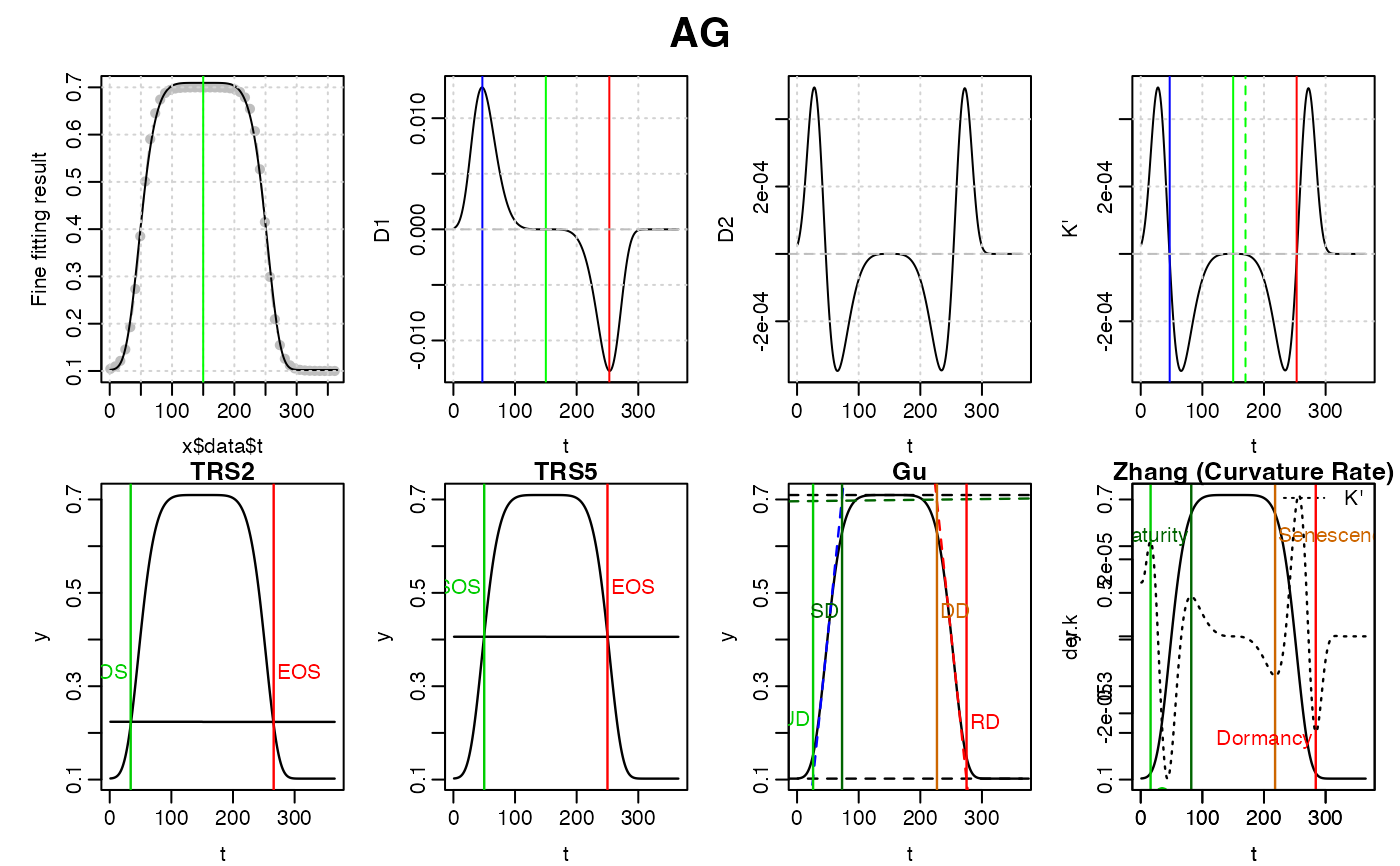
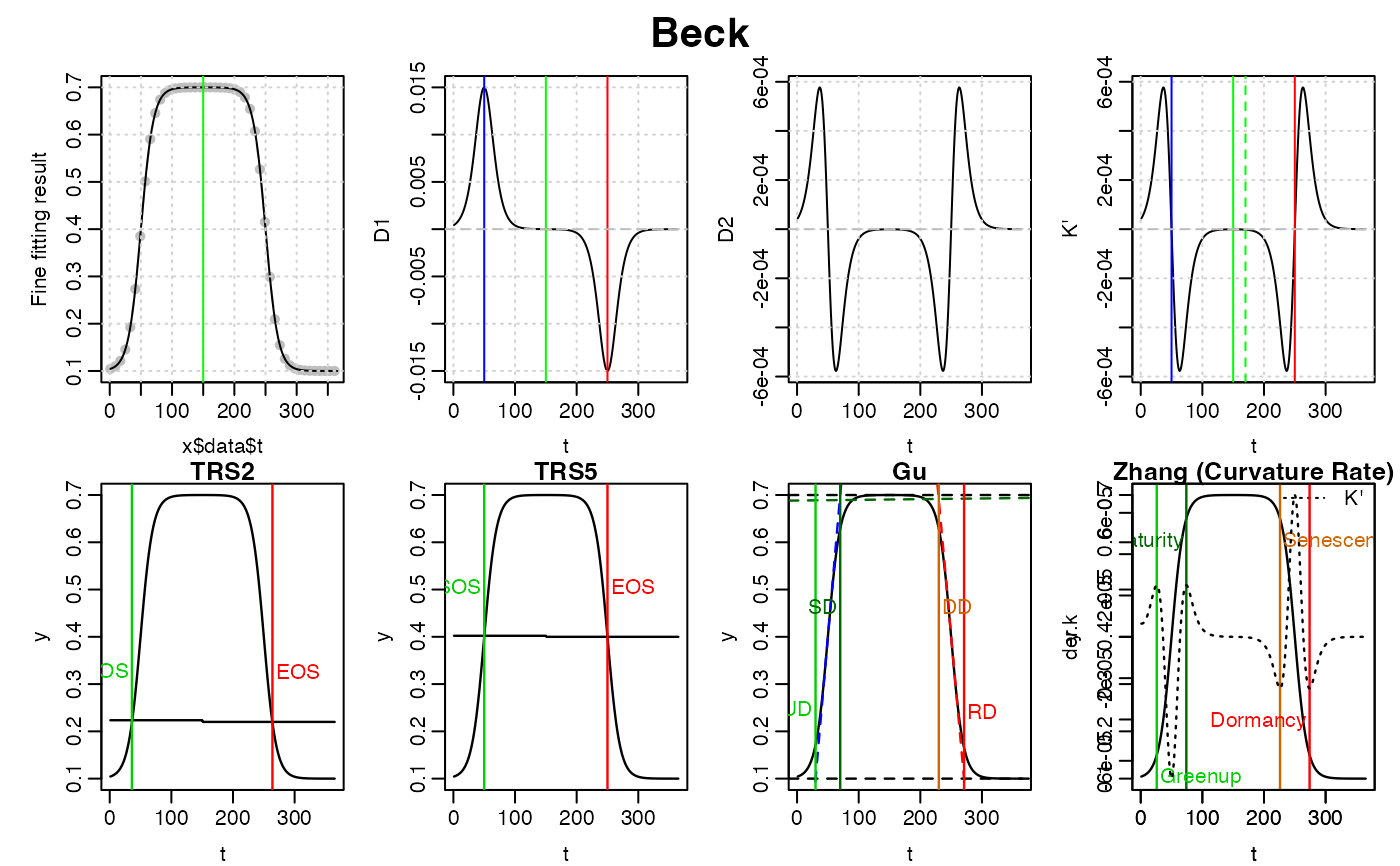
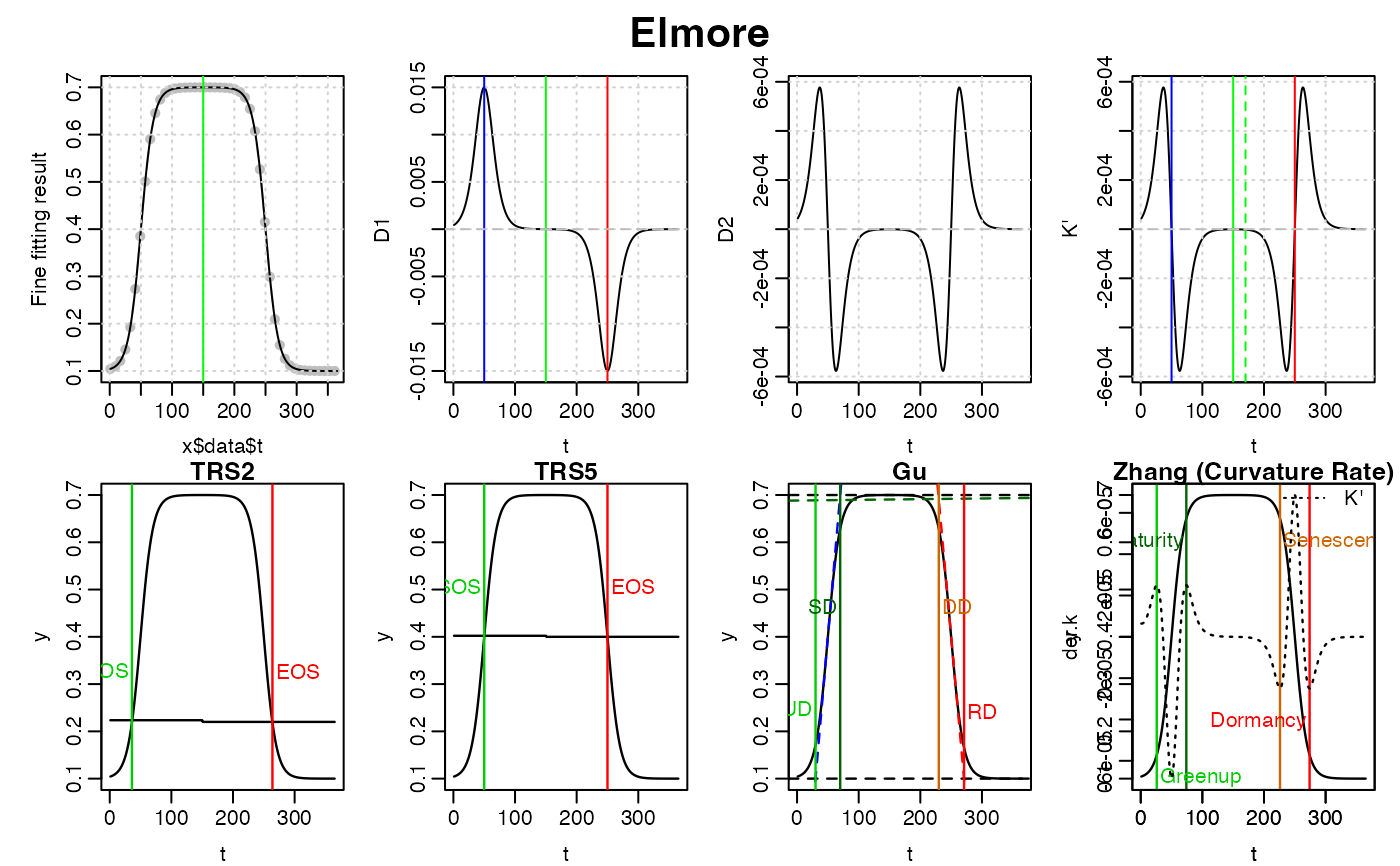
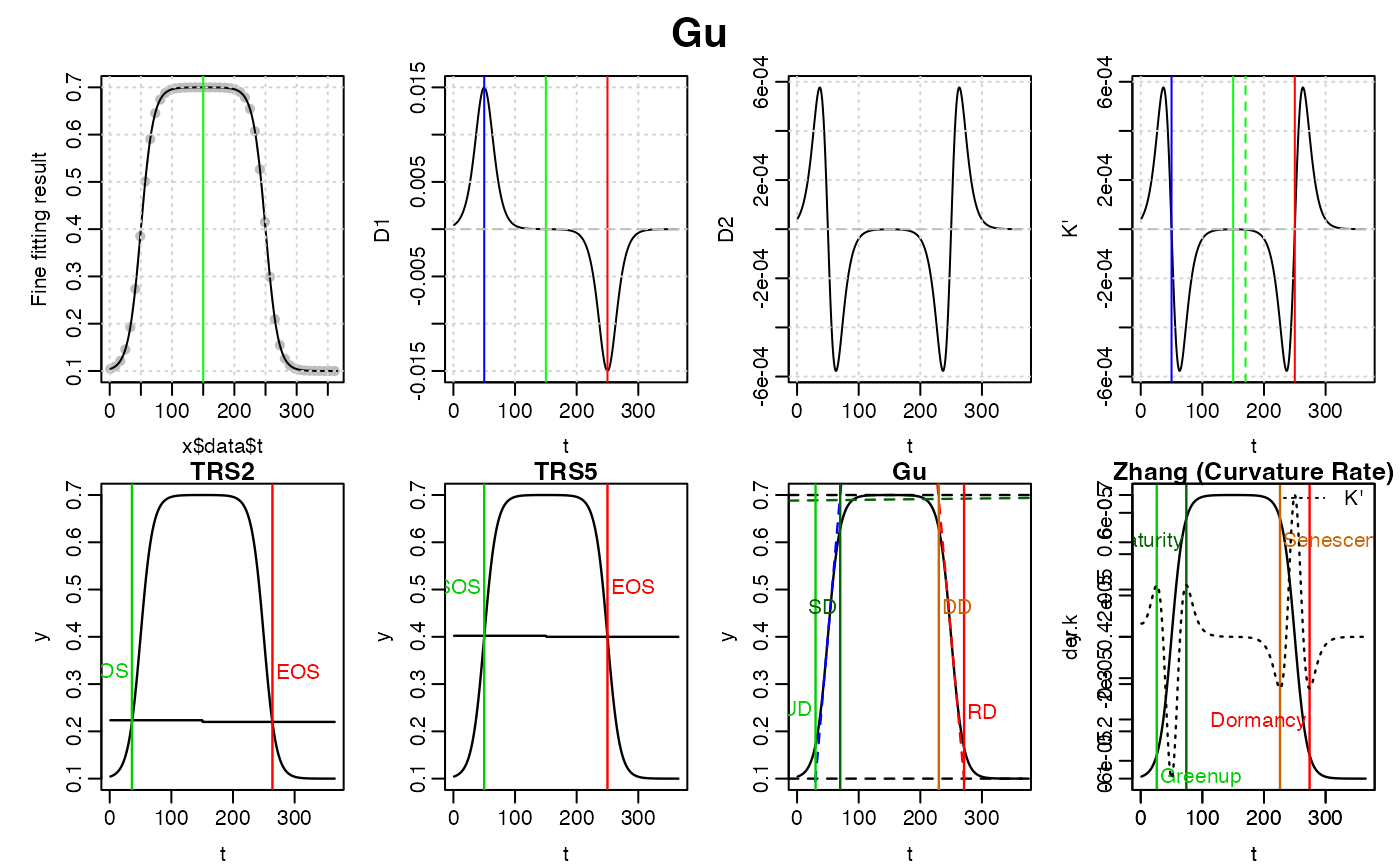
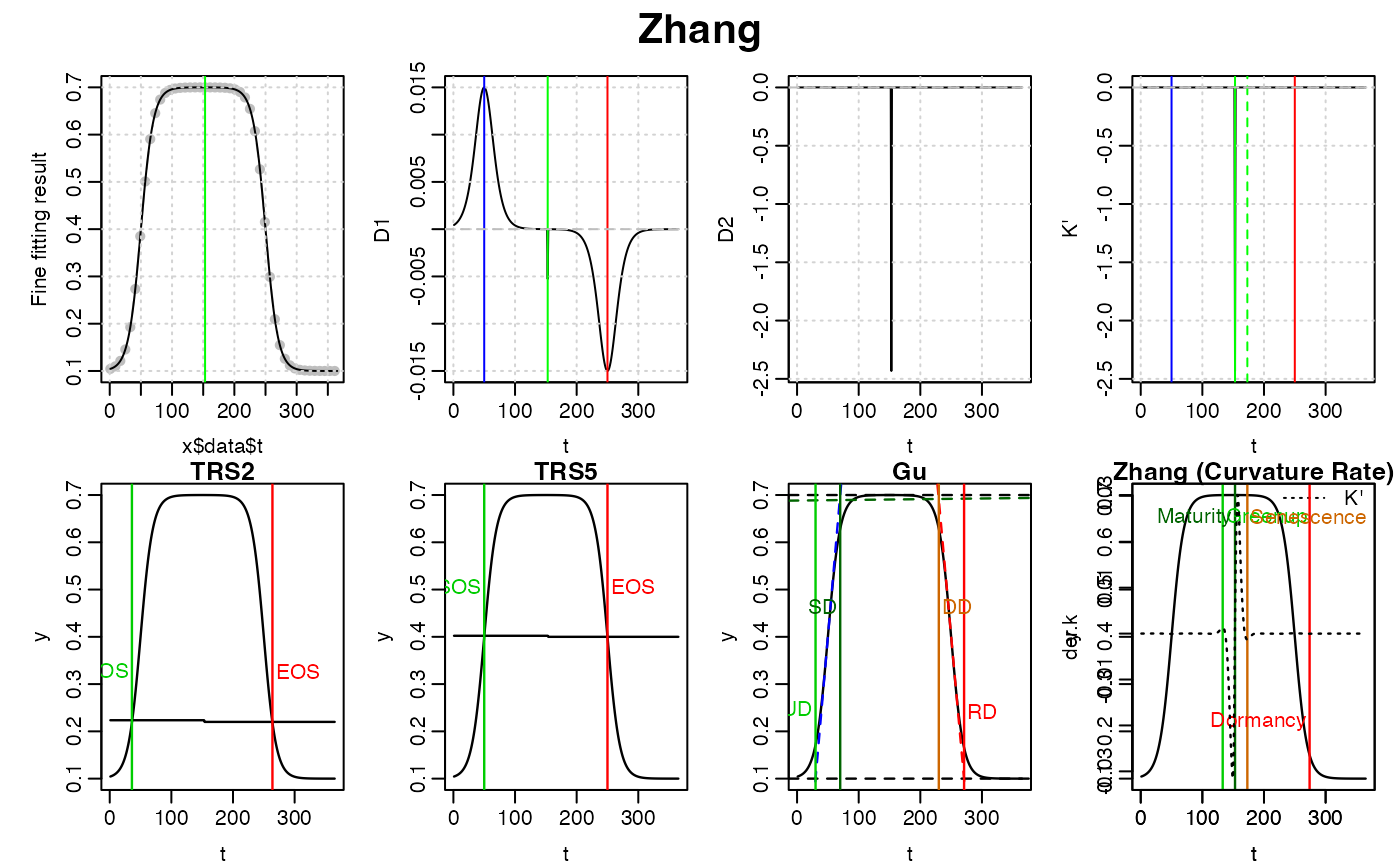
plot curve fitting VI, gradient (first order difference D1), hessian (D2), curvature (k) and the change rate of curvature(der.k)
Arguments
- x
Fine curve fitting object
fFITs()returned bycurvefit().- method
Which fine curve fitting method to be extracted?
- show.pheno
whether to plot phenological metrics.
- ...
other parameters to
curvature().- data
A data.frame with the columns of
c('t', 'y')
See also
Examples
library(phenofit)
# simulate vegetation time-series
fFUN = doubleLog.Beck
par  = c( mn  = 0.1 , mx  = 0.7 , sos = 50 , rsp = 0.1 , eos = 250, rau = 0.1)

t    <- seq(1, 365, 8)
tout <- seq(1, 365, 1)
y <- fFUN(par, t)

methods <- c("AG", "Beck", "Elmore", "Gu", "Zhang") # "Klos" too slow
fit <- curvefit(y, t, tout, methods)

# plot
plot(fit)
