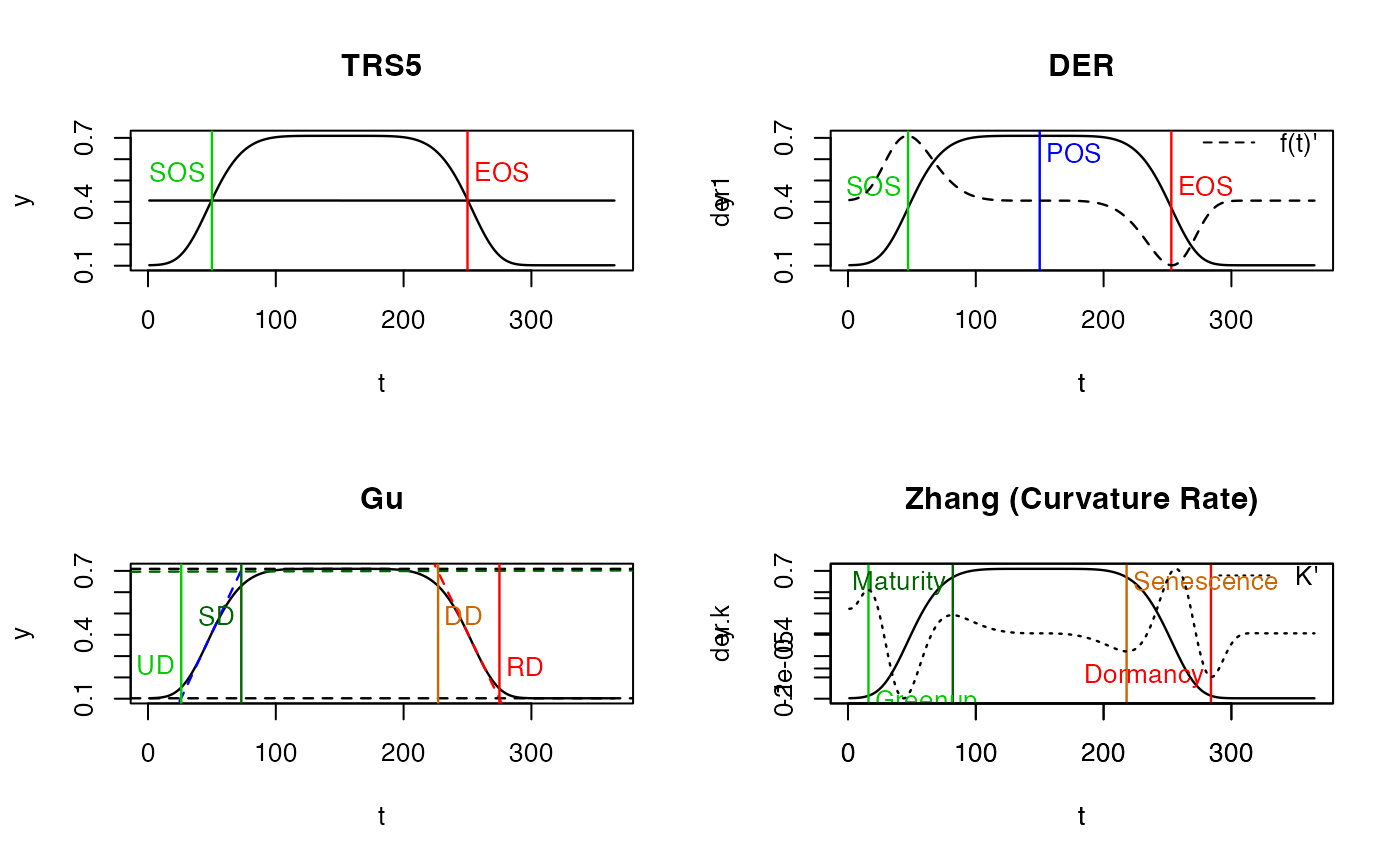
Phenology extraction in GU method (GU)
PhenoGu(x, t, ...)

# S3 method for class 'fFIT'
PhenoGu(x, t = NULL, analytical = FALSE, smoothed.spline = FALSE, ...)

# Default S3 method
PhenoGu(x, t, der1, IsPlot = TRUE, ...)
Arguments
- x
numeric vector, or
fFITobject returned bycurvefit().- t
doyvector, corresponding doy of vegetation index.- ...
other parameters to
PhenoGu.default()orPhenoGu.fFIT()- analytical
If true,
numDerivpackagegradandhesswill be used; if false,D1andD2will be used.- smoothed.spline
Whether apply
smooth.splinefirst?- der1
the first order difference
- IsPlot
whether to plot?
Value
A numeric vector, with the elements of:
UD: upturn dateSD: stabilisation dateDD: downturn dateRD: recession date
References
Gu, L., Post, W. M., Baldocchi, D. D., Black, T. A., Suyker, A. E., Verma, S. B., … Wofsy, S. C. (2009). Characterizing the Seasonal Dynamics of Plant Community Photosynthesis Across a Range of Vegetation Types. In A. Noormets (Ed.), Phenology of Ecosystem Processes: Applications in Global Change Research (pp. 35–58). New York, NY: Springer New York. doi:10.1007/978-1-4419-0026-5_2
Filippa, G., Cremonese, E., Migliavacca, M., Galvagno, M., Forkel, M., Wingate, L., … Richardson, A. D. (2016). Phenopix: A R package for image-based vegetation phenology. Agricultural and Forest Meteorology, 220, 141–150. doi:10.1016/j.agrformet.2016.01.006
Examples
# `doubleLog.Beck` simulate vegetation time-series
t    <- seq(1, 365, 8)
tout <- seq(1, 365, 1)
par  = c( mn  = 0.1 , mx  = 0.7 , sos = 50 , rsp = 0.1 , eos = 250, rau = 0.1)
y <- doubleLog.Beck(par, t)

methods <- c("AG", "Beck", "Elmore", "Gu", "Zhang") # "Klos" too slow
fit <- curvefit(y, t, tout, methods)
x <- fit$model$AG # one model

par(mfrow = c(2, 2))
PhenoTrs(x)
#> sos eos
#>  50 250
PhenoDeriv(x)
#> sos pos eos
#>  47 150 253
PhenoGu(x)
#>  UD  SD  DD  RD
#>  26  73 227 275
PhenoKl(x)

#>    Greenup   Maturity Senescence   Dormancy
#>         16         82        218        284