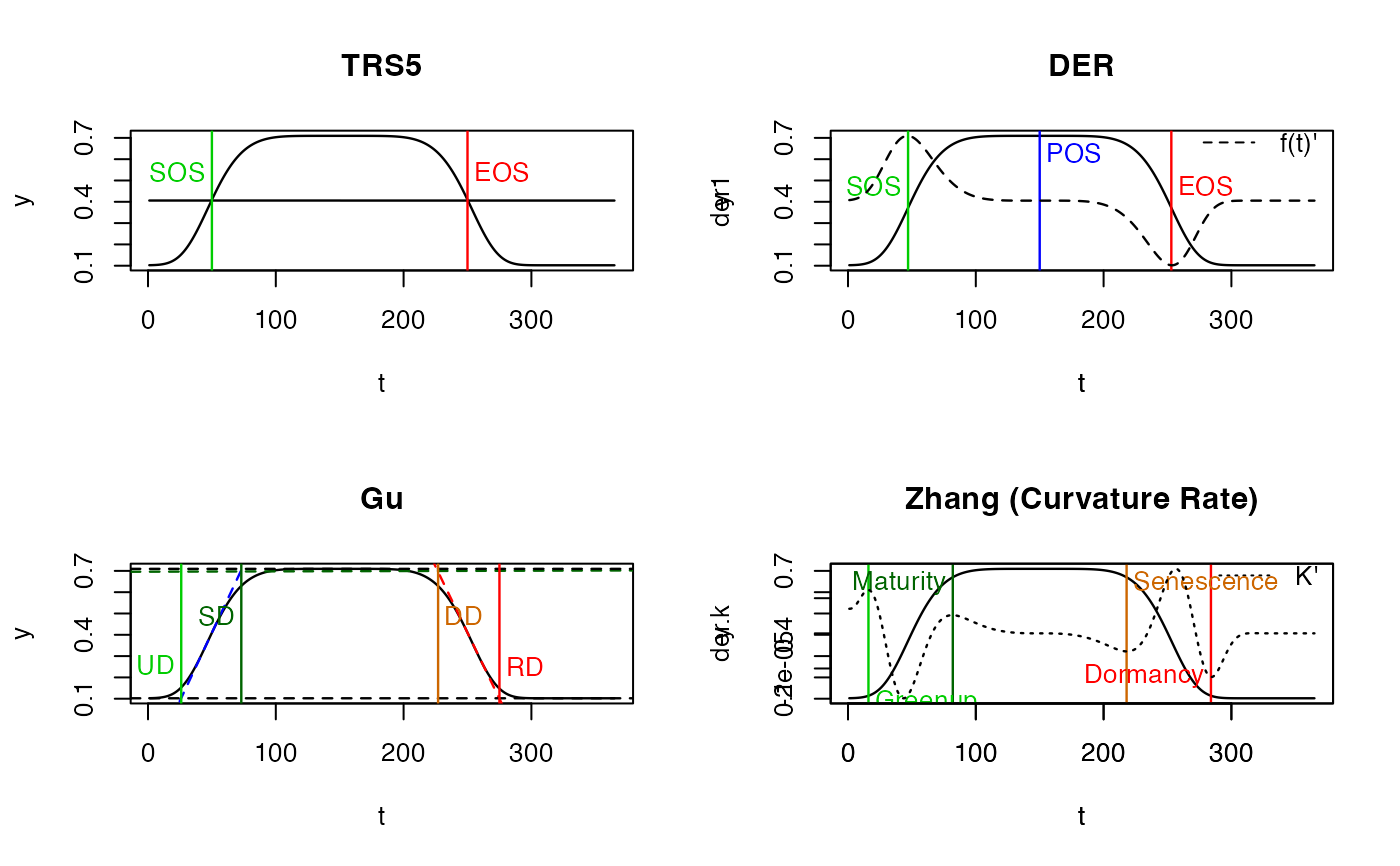
Phenology extraction in Threshold method (TRS)
Arguments
- x
numeric vector, or
fFITobject returned bycurvefit().- t
doyvector, corresponding doy of vegetation index.- approach
to be used to calculate phenology metrics. 'White' (White et al. 1997) or 'Trs' for simple threshold.
- trs
threshold to be used for approach "Trs", in (0, 1).
- asymmetric
If true, background value in spring season and autumn season is regarded as different.
- IsPlot
whether to plot?
- ...
other parameters to PhenoPlot
See also
Examples
# `doubleLog.Beck` simulate vegetation time-series
t    <- seq(1, 365, 8)
tout <- seq(1, 365, 1)
par  = c( mn  = 0.1 , mx  = 0.7 , sos = 50 , rsp = 0.1 , eos = 250, rau = 0.1)
y <- doubleLog.Beck(par, t)

methods <- c("AG", "Beck", "Elmore", "Gu", "Zhang") # "Klos" too slow
fit <- curvefit(y, t, tout, methods)
x <- fit$model$AG # one model

par(mfrow = c(2, 2))
PhenoTrs(x)
#> sos eos
#>  50 250
PhenoDeriv(x)
#> sos pos eos
#>  47 150 253
PhenoGu(x)
#>  UD  SD  DD  RD
#>  26  73 227 275
PhenoKl(x)

#>    Greenup   Maturity Senescence   Dormancy
#>         16         82        218        284