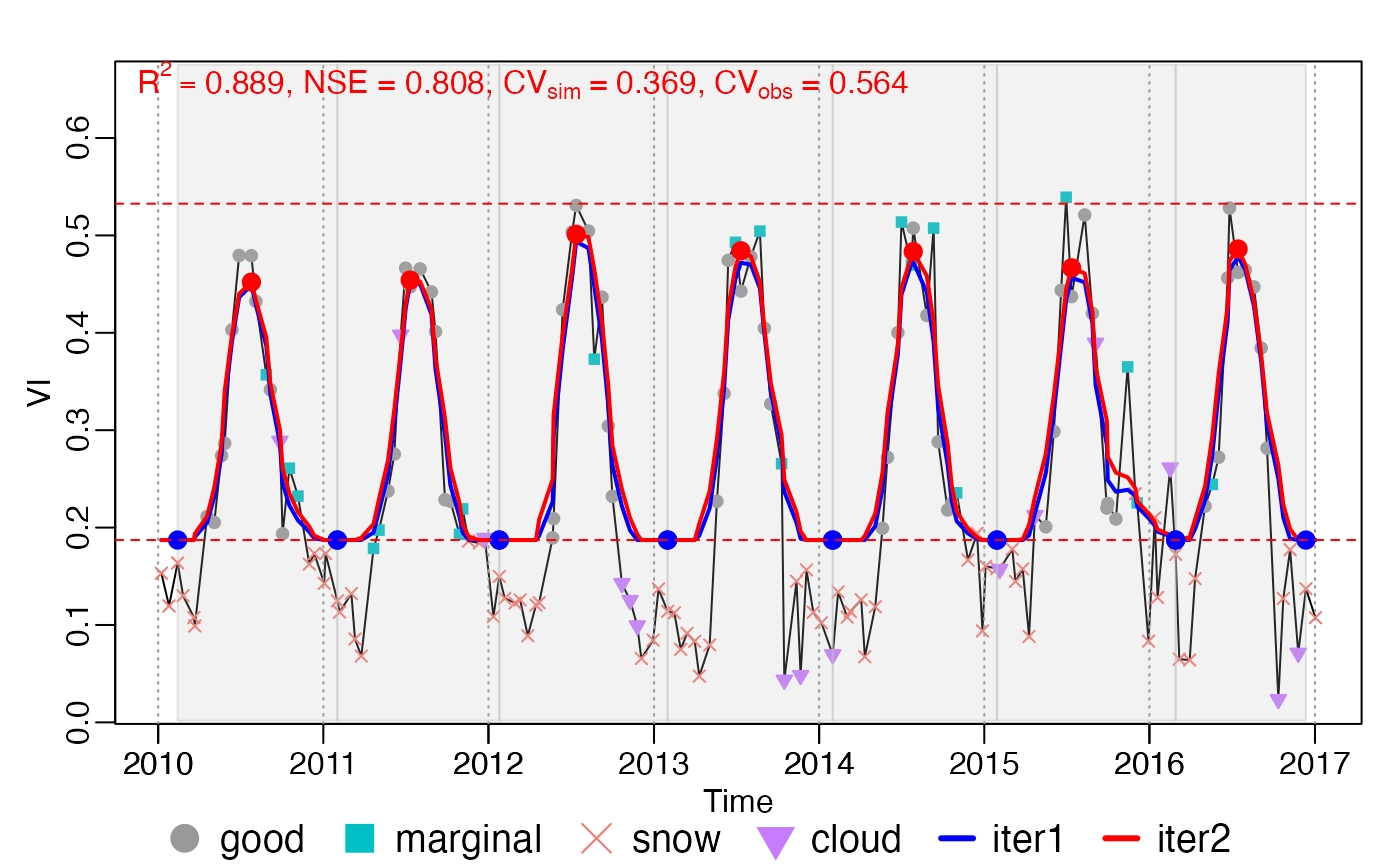
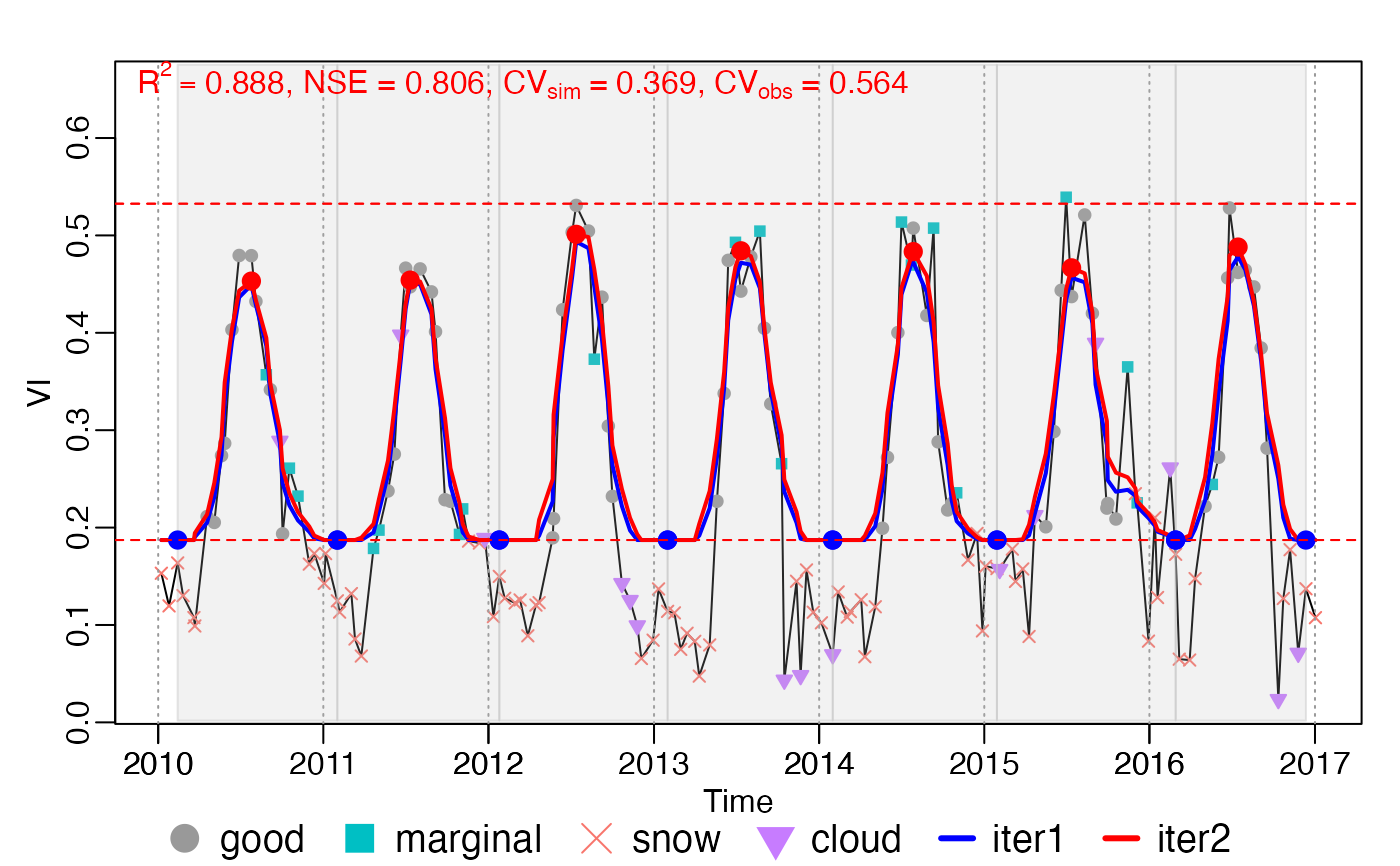
Divide growing seasons according to rough fitting (rFUN) result .
For season, rough fitting is applied for whole.
For season_mov rough fitting is applied in every year, during which
maxExtendMonth is extended.
Arguments
- INPUT
A list object with the elements of
t,y,w,Tn(optional) andylu, returned bycheck_input().- options
see details
- ...
ignored.
Value
fit: A data.table of Rough fitting result, with the columns of (t,y,witer1, ...,witerN,ziter1, ...,ziterN).dt: A data.table of growing season division information, with the columns of (beg,peak,end,y_beg,y_peak,y_end,len,year,season,flag).
Details
Before division growing season, INPUT should be added a year in head
and tail first by add_HeadTail.
Finally, use findpeaks() to get local maximum and local minimum values.
Two local minimum define a growing season.
If two local minimum(maximum) are too closed, then only the smaller(biger)
is left.
options for season
(a) Parameters for rough fitting
rFUN: character (defaultsmooth_wWHIT), the name of rough curve fitting function, can be one ofc("smooth_wSG", "smooth_wWHIT", "smooth_wHANTS"), which are corresponding tosmooth_wSG(),smooth_wWHIT()andsmooth_wHANTS().wFUN: character (defaultwTSM), the name of weights updating functions, can be one of c("wTSM", "wChen", "wBisquare", "wSELF"). SeewTSM(),wChen(),wBisquare()andwSELF()for details.iters: integer (default 2), the number of rough fitting iterations.wmin: double, the minimum weight of bad points (i.e. snow, ice and cloud).verbose: logical (defaultFALSE). IfTRUE,options$seasonwill be printed on the console.lambda: double (default NULL), the smoothing parameter ofsmooth_wWHIT().If
lambda = NULL, V-curve theory will be employed to find the optimallambda. Seelambda_vcurve()for details.
frame: integer (default NULL), the parameter ofsmooth_wSG(), moving window size.If
frame = NULL,framewill be reset asfloor(nptperyear/5)*2 + 1(refered by TIMESAT).
nf: integer (default 4), the number of frequencies insmooth_wHANTS().maxExtendMonth: integer (default 12), previous and subsequentmaxExtendMonth(in month) data were added to the current year for rough fitting.nextend: integer (default NULL), same asmaxExtendMonth, but in points.If
nextendprovided,maxExtendMonthwill be ignored.If
nextend = NULL,nextendwill be reset asceiling(maxExtendMonth/12*nptperyear)
(b) Parameters for growing season division
minpeakdistance: double (default NULL), the minimum distance of two peaks (in points). If the distance of two maximum extreme value less thanminpeakdistance, only the maximum one will be kept.If
minpeakdistance = NULL, it will be reset asnptperyear/6.
r_max: double (default 0.2; in (0, 1)).r_maxandr_minare used to eliminate fake peaks and troughs.The real peaks should satisfy:
\(max(h_{peak, L}, h_{peak, R}) > r_{max} A\)
\(min(h_{peak, L}, h_{peak, R}) > r_{min} A,\) where \(h_{peak, L}, h_{peak, R}\) are height difference from the peak to the left- and right-hand troughs.
The troughs should satisfy:
\(max(h_{trough, L}, h_{trough, R}) > r_{max} A,\) where \(h_{trough, L}, h_{trough, R}\) are height difference from the trough to the left- and right-hand peaks.
r_min: double (default 0.05; in (0, 1)), see abover_maxfor details.r_min<r_max.rtrough_max: double (default 0.6, in (0, 1)), \(y_{peak} <= rtrough_max * A + ylu[1]\).ypeak_min: double 0.1 (in VI unit), \(y_{peak} >= ypeak_min\)..check_season: logical (defaultTRUE). check the growing season length according tolen_minandlen_max. IfFALSE,len_minandlen_maxwill lose their effect.len_min: integer (default 45), the minimum length (in days) of growing seasonlen_max: integer (default 650), the minimum length (in days) of growing seasonadj.param: logical. IfTRUE(default), if there are too many or too less peaks and troughs,phenofitwill automatically adjust rough curve fitting function parameters. SeeMaxPeaksPerYearandMaxTroughsPerYearfor details.MaxPeaksPerYear(optional) : integer (default 2), the max number of peaks per year. IfPeaksPerYear>MaxPeaksPerYear, thenlambda = lambda*2.MaxTroughsPerYear(optional) : integer (default 3), the max number of troughs per year. IfTroughsPerYear>MaxTroughsPerYear, thenlambda = lambda*2.calendarYear: logical (defaultFALSE). IfTRUE, the start and end of a calendar year will be regarded as growing season division (North Hemisphere is from 01 Jan to 31 Dec; South Hemisphere is from 01 Jul to 30 Jun).rm.closed: logical (defaultTRUE). IfTRUE, closed peaks (or troughs) will be further tidied. Only the maximumis.continuous(not used): logical (defaultTRUE). This parameter is forfluxnet2015fluxsite data, where the input might be not continuous.
See also
Examples
data("CA_NS6")
d <- CA_NS6

nptperyear <- 23
INPUT <- check_input(d$t, d$y, d$w,
    QC_flag = d$QC_flag,
    nptperyear = nptperyear, south = FALSE,
    maxgap = nptperyear / 4, alpha = 0.02, wmin = 0.2
)
# plot_input(INPUT)

wFUN <- "wTSM"
# all year as a whole
options = list(rFUN = "smooth_wWHIT", wFUN = wFUN, lambda = 10)
brks <- season(INPUT, lambda = 10)
plot_season(INPUT, brks, d)


brks2 = season_input(INPUT, options)
all.equal(brks2, brks)
#> [1] TRUE

c(d_fit, info_peak) %<-% roughFit(INPUT)
d_season = find_season.peaks(d_fit, info_peak)

c(t, ypred) %<-% d_fit[, .(t, ziter2)]
d_season = find_season.default(ypred, t)
all.equal(brks$dt, d_season)
#> [1] TRUE

# opt <- .options$season
# brks$fit - d_fit # function passed test

# curve fitting by year
brks_mov <- season_mov(INPUT,
    options = list(
        rFUN = "smooth_wWHIT", wFUN = wFUN,
        lambda = 10,
        r_min = 0.05, ypeak_min = 0.05,
        verbose = TRUE
    )
)
#>   [season_mov] running 1 ...
#> iloop = 1: lambda = 10.0, ntrough_PerYear = 0.00, npeak_PerYear = 0.00
#> iloop = 2: lambda = 5.0, ntrough_PerYear = 0.00, npeak_PerYear = 0.00
#> iloop = 3: lambda = 2.5, ntrough_PerYear = 0.00, npeak_PerYear = 0.00
#>   [season_mov] running 2 ...
#> iloop = 1: lambda = 10.0, ntrough_PerYear = 0.00, npeak_PerYear = 0.00
#> iloop = 2: lambda = 5.0, ntrough_PerYear = 0.00, npeak_PerYear = 0.00
#> iloop = 3: lambda = 2.5, ntrough_PerYear = 0.00, npeak_PerYear = 0.00
#>   [season_mov] running 3 ...
#> iloop = 1: lambda = 10.0, ntrough_PerYear = 0.00, npeak_PerYear = 0.00
#> iloop = 2: lambda = 5.0, ntrough_PerYear = 0.00, npeak_PerYear = 0.00
#> iloop = 3: lambda = 2.5, ntrough_PerYear = 0.00, npeak_PerYear = 0.00
#>   [season_mov] running 4 ...
#> iloop = 1: lambda = 10.0, ntrough_PerYear = 0.00, npeak_PerYear = 0.00
#> iloop = 2: lambda = 5.0, ntrough_PerYear = 0.00, npeak_PerYear = 0.00
#> iloop = 3: lambda = 2.5, ntrough_PerYear = 0.00, npeak_PerYear = 0.00
#>   [season_mov] running 5 ...
#> iloop = 1: lambda = 10.0, ntrough_PerYear = 0.00, npeak_PerYear = 0.00
#> iloop = 2: lambda = 5.0, ntrough_PerYear = 0.00, npeak_PerYear = 0.00
#> iloop = 3: lambda = 2.5, ntrough_PerYear = 0.00, npeak_PerYear = 0.00
#>   [season_mov] running 6 ...
#> iloop = 1: lambda = 10.0, ntrough_PerYear = 0.00, npeak_PerYear = 0.00
#> iloop = 2: lambda = 5.0, ntrough_PerYear = 0.00, npeak_PerYear = 0.00
#> iloop = 3: lambda = 2.5, ntrough_PerYear = 0.00, npeak_PerYear = 0.00
#>   [season_mov] running 7 ...
#> iloop = 1: lambda = 10.0, ntrough_PerYear = 0.00, npeak_PerYear = 0.00
#> iloop = 2: lambda = 5.0, ntrough_PerYear = 0.00, npeak_PerYear = 0.00
#> iloop = 3: lambda = 2.5, ntrough_PerYear = 0.00, npeak_PerYear = 0.00
plot_season(INPUT, brks_mov)


rfit <- brks2rfit(brks_mov)
r <- get_pheno(rfit)